 pROC 1.0 released
After years of work with ROC curves in R, first with packages such as ROCR and verification, then with custom functions; and 4 months of development to create a coherent package, extensive discussions about its name (SwissROC was the first thought (but is Switzerland still a selling argument?), or Rocker (that's a bit similar to the already-existing ROCR)) and its licensing (let's go with GPL), I'm glad to announce the release of pROC!
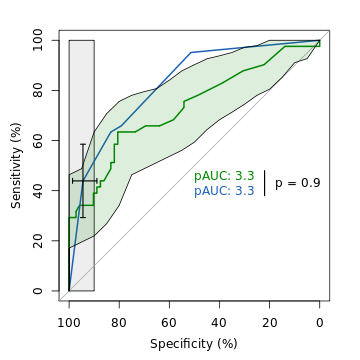
 An example of ROC analysis with pROC.
pROC is a set of tools to visualize, smooth and compare receiver operating characteristic (ROC curves). Full or partial area under the curve (AUC) can be compared with statistical tests based on U-statistics or bootstrap. Confidence intervals can be computed for (p)AUC or ROC curves. It is available for R (command-line interface) and S+ (with an additional graphical user interface).
You can find it on ExPASy (thanks Céline from the SIB web-team) and in a few minutes on the CRAN (it has to pass a few checks before it is formally accepted).
But there is no need to download the package. The installation can be done in one command directly from R:
install.packages("pROC")
The package must then be loaded with:
library(pROC)
To get help, enter the following in the R prompt:
?pROC
And that's it! You can have a look at the screenshots to see what it looks like.
Simultaneously we submitted a paper (a short application note) describing it to Bioinformatics. Crossed fingers in the hope it will be accepted!
2010-06-15 follow-up: the paper has been rejected. We will resubmit it to BMC Bioinformatics.
2011-03-17 follow-up: the paper was published in BMC Bioinformatics.
Xavier Robin
Publié le mardi 27 avril 2010 à 20:42 CEST
Lien permanent : /blog/2010/04/27/proc-1.0-released
Tags :
pROC
Commentaires : 0
Commentaires
Aucun commentaire
 Chercher
 Tags
Tags Billets récents
 Calendrier
 Syndication
 Recommender